Erin Shellman
Case-study: Tableau
Note: This is a demonstration of the types of questions and artifacts I would generate in the process of conducting a software evaluation. I used my previous experience with these tools and a cursory review of their documentation to make reasonable judgements, but this is by no means comprehensive.
Current solution and problem statement
The entire organization wants to optimize costs by moving away from paid applications, like Tableau, towards open-source or free solutions. Any dashboarding solution at KCRHA needs:
- Usability for technical and non-technical users. We want to empower anyone within the organization to explore data regardless of their aptitude for programming.
- Security. We need to manage access to certain data assets that may contain PII and other sensitive data at a user level.
- Publication flexibility. We want to publish both to internal and external customers.
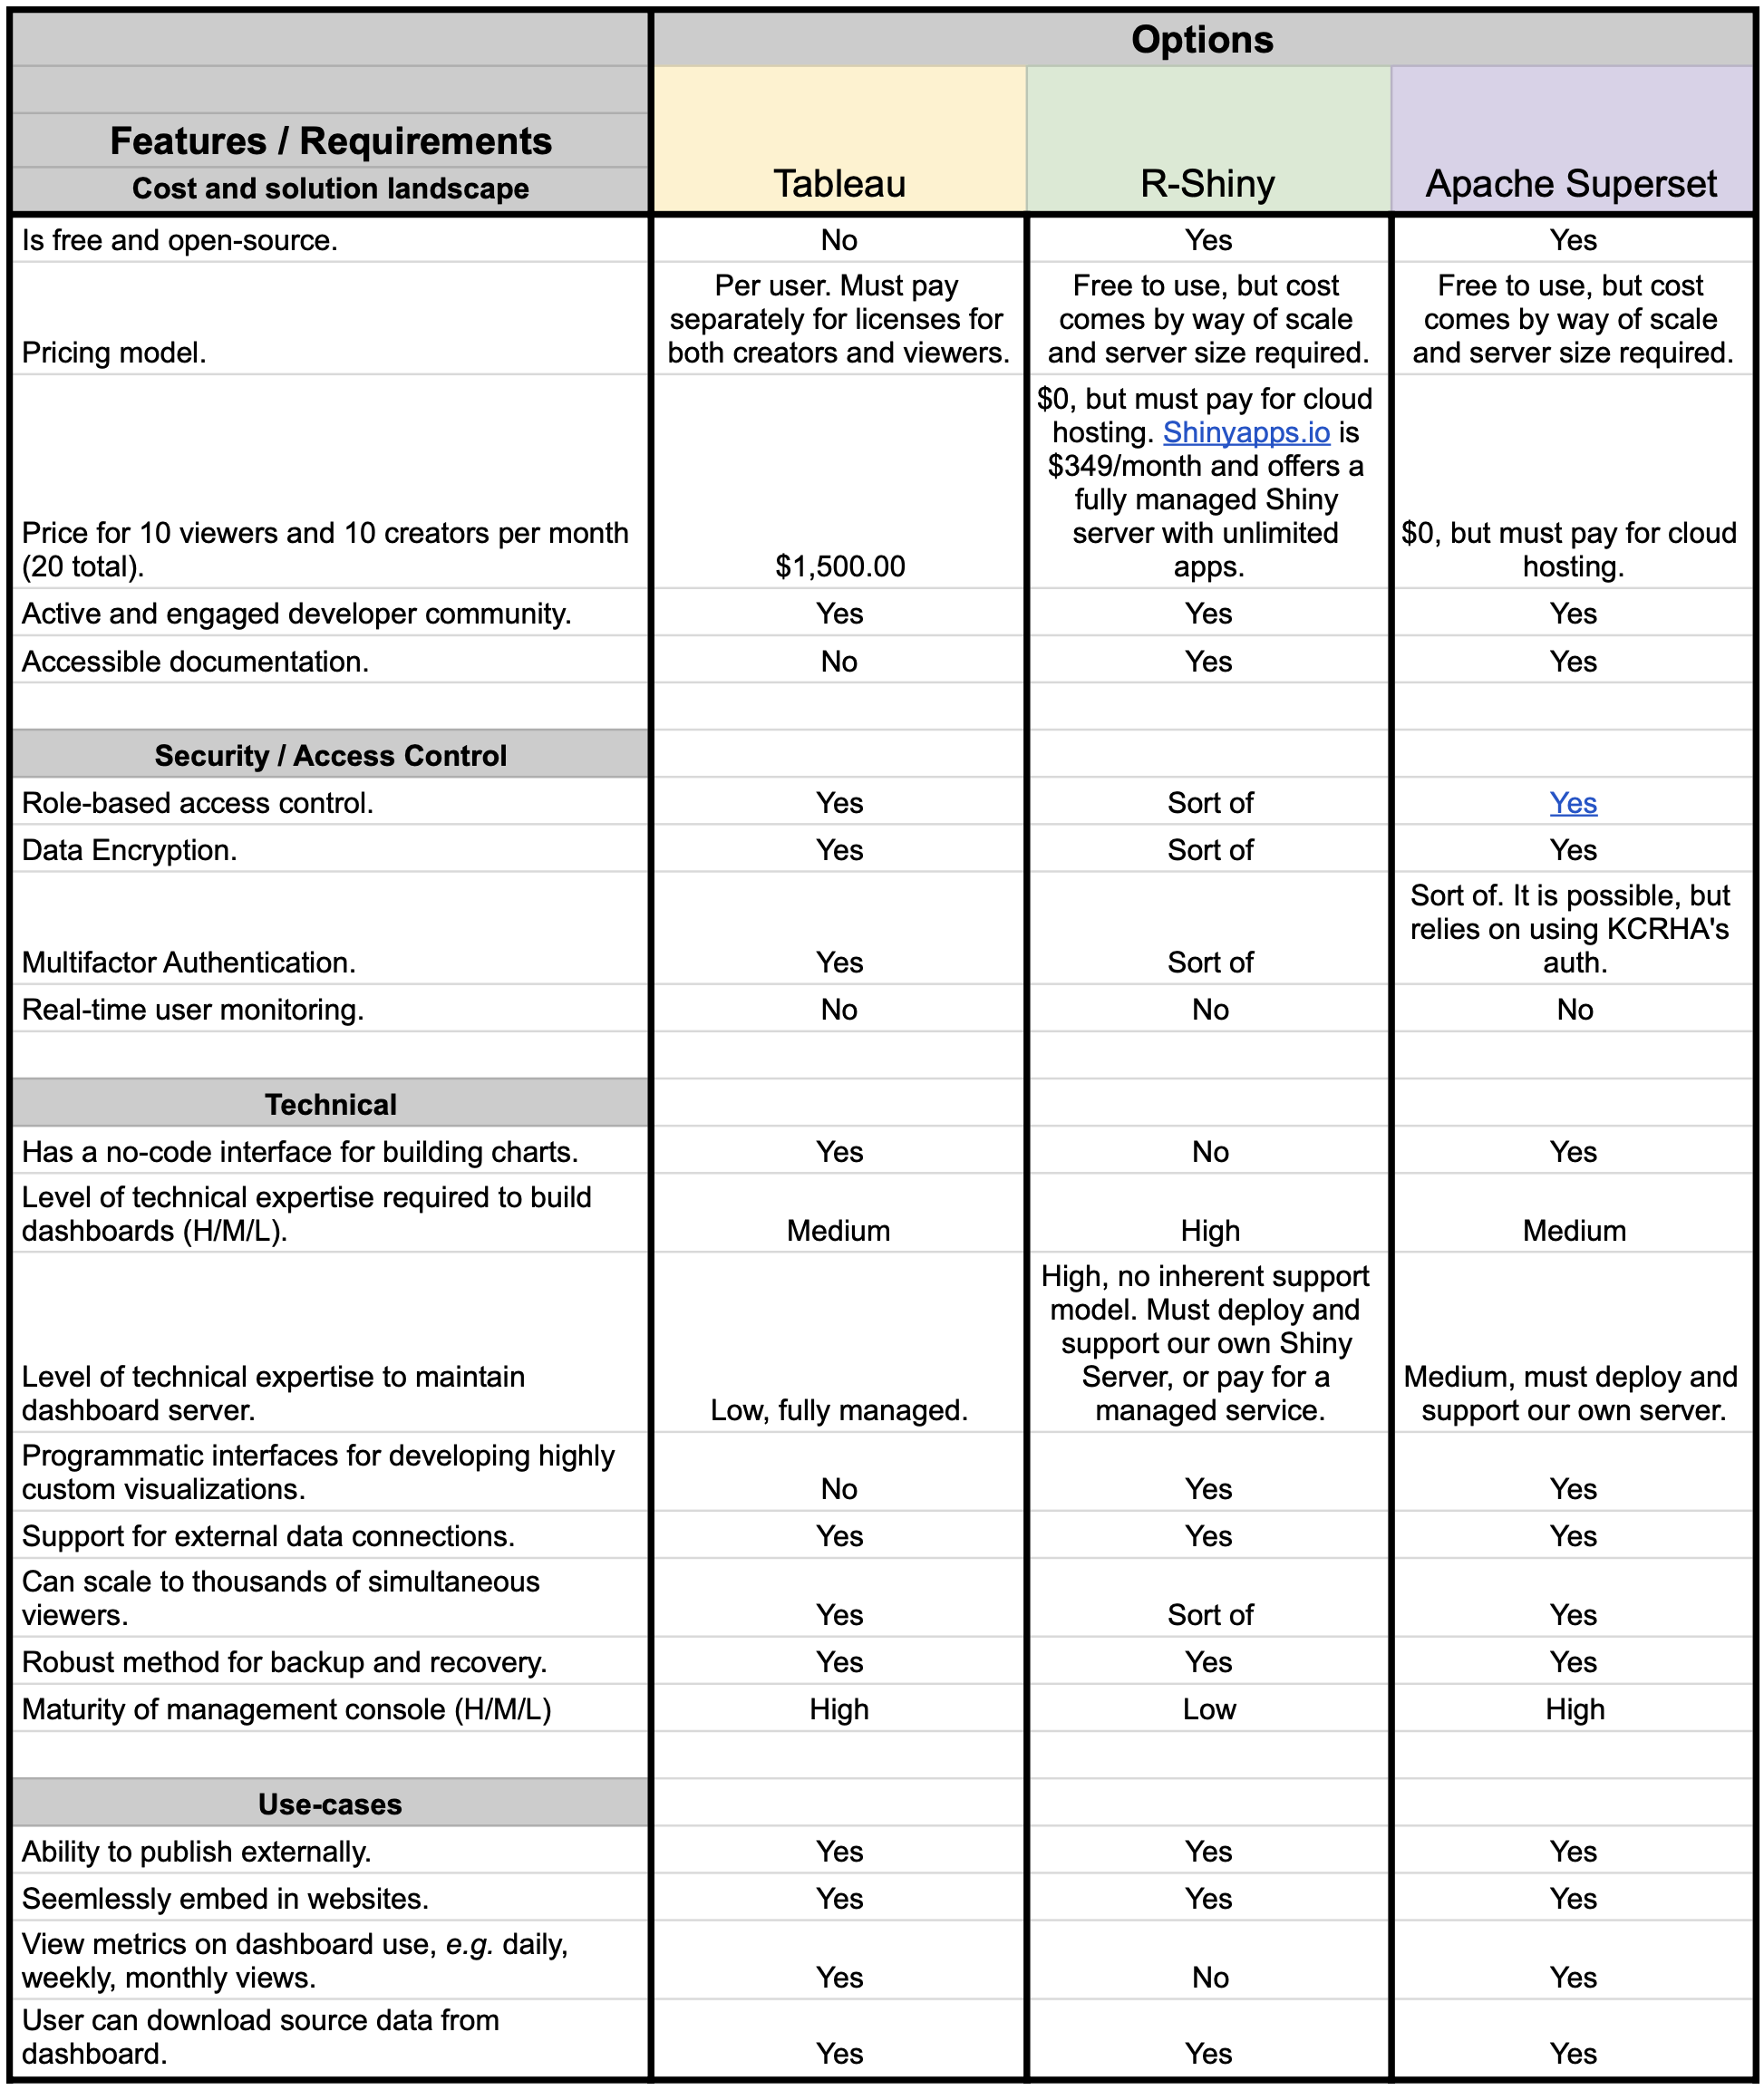
Side-by-side comparison
Considerations
-
Managed services vs. roll-your-own. With managed services like Tableau we pay for both the cloud resources and support in addition to the product. While open source alternatives look cheap by comparison, that is in large part because the costs associated with deploying and supporting our own hardware are not included. Moving away from Tableau means that our internal IT teams would need to support the server and potentially be on-call when issues arise. This could require additional staffing or deprioritization of other work that should be contemplated as part of the true cost of the solution.
-
Management console. Both Tableau and Superset have mature management consoles that allow dashboard creators to manage access, view user statistics, and configure their dashboards. Similar functionality can be achieved with Shiny / Shiny Server, but only through an assortment of R packages of varying quality and completeness. The decentralized nature of the R ecosystem is at times a great strength, but in this instance is a distinct weakness compared to the more focused product offerings of Tableau and Superset.
-
Some nice-to-haves. The Superset console also includes a SQL editor called SQL Lab where users can interactively construct queries and get immediate results. This is not part of the dashboard itself but is a great feature for quick data exploration, troubleshooting, and educational support for working with SQL.
Decision
Shiny has many benefits, chiefly that is an R-based tool and KCRHA has many existing R users. However it lacks critical functionality like the ability to explore data and build dashboards without programming, the need to re-write significant boilerplate HTML for each new dashboard, relatively slow performance, and fewer options for managed instances. Shiny is a strong tool for prototyping for people who can program in R, but is not an appropriate tool to support KCRHA’s needs at large.
Apache Airflow has many core capabilities built in, has a mature management console, and is more similar to Tableau which will ease the transition.
Change management
The following is a rough sketch of the types of activies and the rough sequence of events to support the roll-out and changeover. IT and engineering will need to work ahead to deploy the platform before dashboard development can begin.
- Conduct a census of all existing dashboards. For each existing dashboard:
- Estimate the daily, weekly, monthly active users to identify which are mission critical, and which are not.
- Those which are seldom used or stale, should be deprecated. Begin deprecation path by alerting all past viewers of the deprecation date. This communication should be an invitation to speak up if users still need the dashboard and multiple notifications should be sent to minimize the potential for surprises.
- Prioritize the keepers by number of users, complexity, and whether they are mission critical (e.g. required for regulatory purposes or for operations), and stage them into 3 phases of work to be completed in, for example, 1, 3 and 6 months corresponding with their priority and complexity.
- In parallel, work with IT and engineering to define roadmap for the Superset server including provisioning initial hardware, dashboard backup and recovery plan, rough definition of scale-up path as necessary, and exploration of how to implement two-factor authentication.
- Estimate the daily, weekly, monthly active users to identify which are mission critical, and which are not.
- Rebuild dashboards.
- The engineering team will need to quickly stand-up the server, define a backup strategy, and develop a CI/CD workflow.
- Analytics team to organize and assign the work according the priority and timeline of dashboard delivery. Internally they will need to rebuild and test their dashboards prior to re-release.
- This is a time of rapid exploration and is also the point at which there’s still time to discover challenges, revise timelines, and course correct.
- Release new dashboards and on-board broader KCRHA community.
- Establish weekly meeting to demo rebuild dashboards as they roll-out, review the backlog and timelines, and collect/respond to feedback from the broader user base.
- It will likely also be helpful at this point to begin writing and publishing techincal documentation about how to access and use Superset.
- Create weekly office hours and biweekly training sessions.
- Monitor user statistics for adoption.
- Because we started by benchmarking Tableau dashboard usage, we now have a basis for comparison and a general idea of who was using which dashboards. If re-adoption of new dashboards is below expectation, follow-up with former users for feedback.
- After some time, say 3 and 6 months, collect broader feedback on usability of Superset broadly and make adjustments to configuration, training, etc. as needed.