Erin Shellman
HMIS design
The following diagram shows the rough architecture of a HMIS data platform primarily through the lens of a KCRHA analyst, though the user persona could be any KCRHA employee. The overall flow is composed largely of open-source tools and comprises 5 functional areas from data ingestion through data delivery to end-users. The overarching goal is to build a data platform that makes it easy to quickly answer quantitative questions and supprt end-users with data.
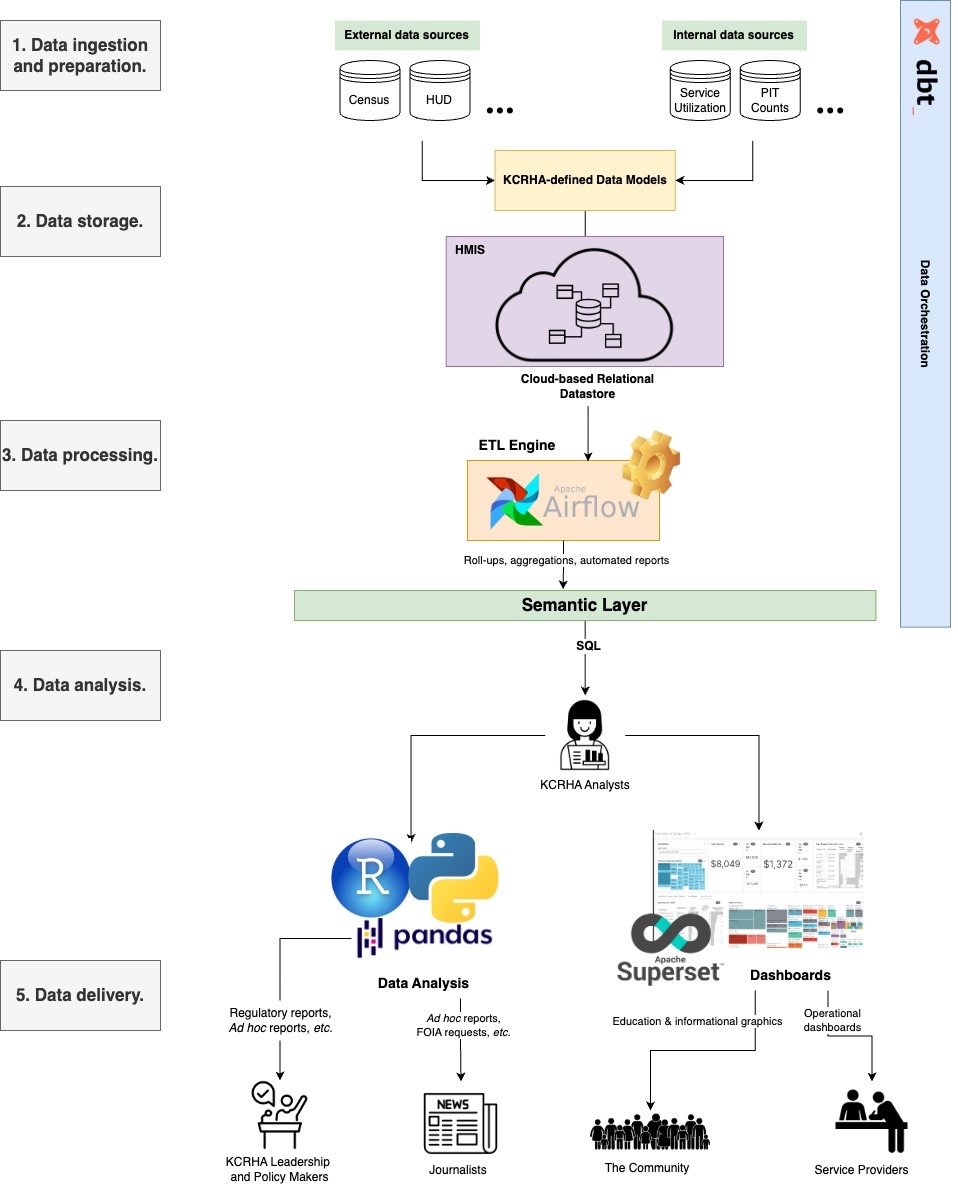
The data ingestion step involves querying and structuring data according to KCRHA-defined data models. External data sources like the Census/ACS change field names frequently, which risks introducing breaking changes to downstream data processes. The data modeling step is important to insure that even as upstream field names change over time, internal field names are stable and do not break downstream applications. Part of data modeling also pertains to the initial database design. Specifically, what tables and dimensions are needed to model core concepts in the data ecosystem, e.g. location, services, people, inventory, etc.? Once those entities are defined, they can be used to organize and store both internal and external data holistically.
The data processing step is where raw data are transformed, aggregated, and summarized into conceptually meaningful, analysis-ready datasets in the semantic layer. Apache Airflow is a powerful ETL tool that allows data engineers and analysts to express data processing tasks as directed acyclic graphs, or DAGs. Airflow has a rich management console that would enable team members to manage their DAGs, view runtime data, and troubleshoot performance bottlenecks in their analytical steps. Examples could include computing daily, weekly, monthly service utilization statistics to power operational dashboards for providers.
In the analysis phase, KCRHA analysts query the semantic layer to conduct analyses, generate reports, or build dashboards. These reports and dashboards are the primary deliverables to the end-users.
DBT is a tool for data orchestration and would be the glue between all the parts. Specifically, DBT can store data models, schedule and manage jobs, and auto-generate documentation and data dictionaries.
Technology considerations
All of the described tools are deployable on any cloud service. Only the relational database would vary depending on whether KCRHA uses AWS, Google Cloud, or Azure. Options include Redshift on AWS, BigQuery on Google, or DataLake on Azure.
Similar to the roll-out plan for Apache Superset in question 1, an assessment of the existing data platform begins with collecting data on current performance, e.g. data consumption patterns, ETL frameworks and their performance, understanding the users of the platform, and the end-users of data products. Beyond technical benchmarking, it’s critical to interview users one-on-one to get candid feedback and their opinions on what works and doesn’t work in the status quo.
Data privacy and security
Each functional area can be an opportunity to apply privacy and security steps as needed. For example, de-identification of data can be done in the ingestion step as part of the preparation of data that flows into the platform. Likewise during ETL we often build aggregations that would exclude user-level identifiers and instead focus on larger populations of people. At the analysis level, role-based access control can be applied and managed through any cloud provider to only permit analysts with the appropriate credentials. Similarly, cloud offers all offer encrypted data transfer that can be used to protect against bad actors intercepting readable data as it moves between data services like the relational store and Airflow. Finally, KCRHA analysts are the last check on data published to end-users in reports and dashboards, and should view it as a responsibility to ensure that any outgoing data does not contain sensitive data.
Getting started
The best entry point for working with the HMIS would be using SQL to construct datasets for analysis. SQL statements can be embedded within many tools, including in R or Python code. But I’d recommend starting with VS Code, or any interactive SQL editor to quickly explore tables and build datasets. DBT can generate documents and data dictionaries and those are great companions for getting up to speed.